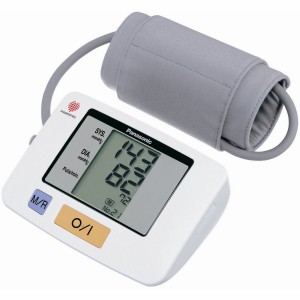
I’ve been meaning to hack my blood pressure monitor for a while, and I finally got around to doing it! So, the idea is to mod a regular electronic blood pressure monitor to make it wireless and connected to the Internet, much like iHealth BP5 or Withings’. That makes detecting trends in your blood pressure much easier, since you can chart the data and even correlate it with other health data, such as how much sleep you’ve been getting, your weight or your level of activity. The model I have is the EW3106 from Panasonic. It’s quite old but from what I’ve seen the design hasn’t changed much throughout the years.
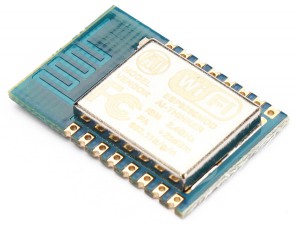
The other part of the solution is the ESP8266. It’s an awesome little WiFi module. It has a TCP stack and only uses about 20% of it’s CPU resources, which means you can run your own software on it, with no need for an external MCU. Some cool guys have added support to the Arduino environment, which makes it really easy to use. And when you consider it costs little more than $4 it’s really a no-brainer.
Since the unit has a feature to store measurements (the blue M/R button), I figured it would probably have a memory chip connected to an I²C bus. My idea was to, whenever the user decided to save a new measurement, retrieve the data stored by the MCU, make sense of it and push it to the cloud.
Disclaimer
 Should you choose to attempt this project on your own, keep in mind you’re modifying a medical device and that CAN interfere with its accuracy and reliability. Remember that a WiFi device emits RF which can affect other devices. If you choose to modify it, don’t use it as a medical device anymore. Use this information and code at your own risk. I cannot be held liable if, knock on wood, your house burns down or your dog dies!
The insides of the the EW3106
This type of blood pressure monitor is known as an oscillatory blood pressure device. The way it works is it inflates the cuff so the pressure around your brachial artery is high enough that it collapses, completely blocking the flow of blood. Then, it starts slowly releasing the pressure until the unit can hear the blood “wooshing” through the compressed artery. That’s your systolic pressure. It then keeps on releasing the pressure until it cannot hear it anymore. That’s your diastolic pressure.
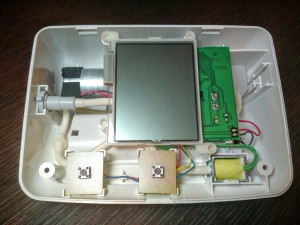
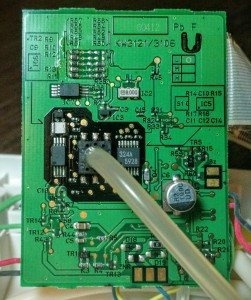
The unit was quite a hassle to open. I hate these plastic hooks, it’s hard to open without breaking them or damaging the plastic, even though they make a lot of sense from a manufacturing point of view. Some elbow grease and a bit of patience and it came off. This is how the monitor looks inside. There’s a PCB with the LCD on top, two switches, an air pump (the metal part in the left upper corner) and a valve (yellow thing, lower right corner). When you press the button the valve closes and the pump inflates the cuff, while the MCU samples a pressure transducer connected to the cuff. The MCU can be seen on the top side of the board, along with two smd potentiometers, which are probably used to calibrate the unit.
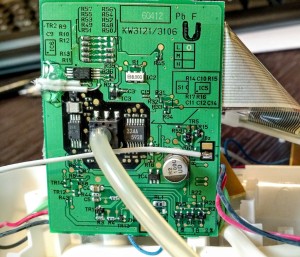
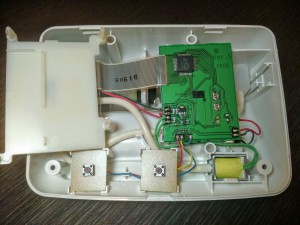
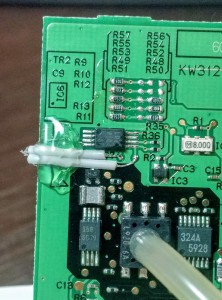
On the bottom side of the board you can see the pressure transducer with tubing attached. And there it is at the top! An I²C EEPROM. You can’t really see it in the picture, but it has the marking L02W104 on it. I looked for a part that would make sense with that marking, and came up with the BR24L02W from Rohm. From what I gather L is the operating temperature range (-40C to 85C), while 02 means a 2 Kbit chip, or 256 bytes. 104 probably refers to the lot. Anyways, with that figured out I went on to tapping the I²C bus.
Sniffing the I²C Bus
Using the datasheet as a reference I hooked up some thin wires to the bus. That’s SDA (data) and SCL (clock). In case you need a primer on how an I²C bus works, check this Wikipedia article. One thing to keep in mind is that the chip works with 3.3V logic, so plan accordingly and make sure you don’t fry it.
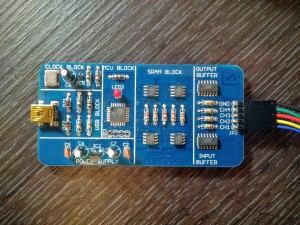
The next step is hooking up a logic analyzer to that bus, so we can listen to what’s going between the MCU and the memory chip. A logic analyzer is a great tool to have on your bench. It allows you to sample digital signals and helps you make sense of it. Again, Wikipedia is your friend. I use it a lot more than my oscilloscope, and it’s also much cheaper. This is the one I have:
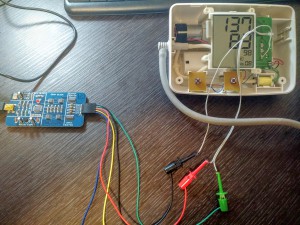
It’s the Scanalogic-2 by Ikalogic, and that one is a kit version that you buy and assemble at home. It’s quite cheap at 33 Euros. You can also buy it assembled for 49 Euros. It’s USB and you can download an application from the manufacturer for free, it’s called ScanaStudio and it has lots of useful things like protocol decoders. Anyways, this is how things look once it’s hooked to the I²C bus. The third wire you see is ground.
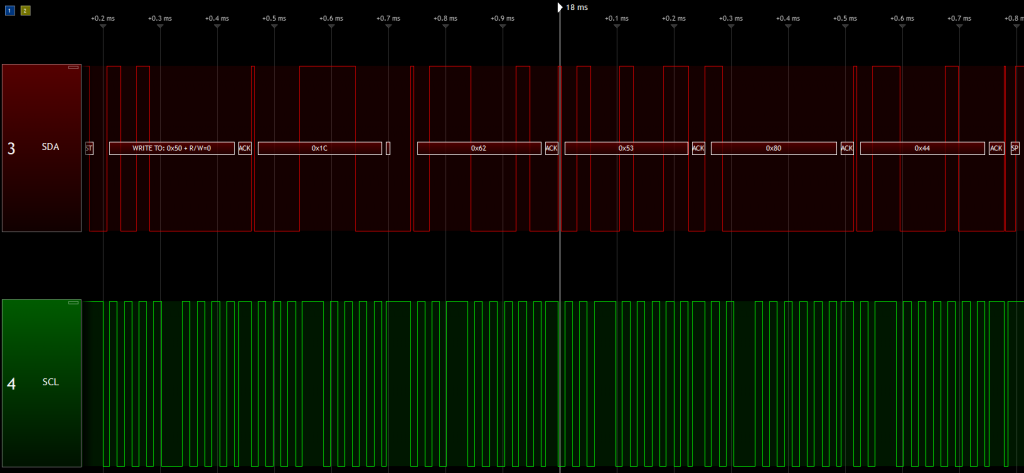
The next step was sniffing the communication between the MCU and the memory chip. In order to do that I set the trigger, started the logic analyzer and asked the monitor to save a new measurement. This is what it looks like. The green signal is the clock line while the red one is the data line. In this chart you can see the MCU writing data to the memory chip.
Making sense of the data

That is what’s going on in the chart above. I know it’s obvious, but anyway, the bytes are in hex format. Here you can see the start condition, the MCU addressing the memory chip for writing (50) and sending 5 bytes. The first byte (1C) is the address in the memory chip that the MCU wants the data written to. The next 4 bytes are the one we are are most interested in. The second byte (62) is the pulse, which is 98 beats per minute in decimal. The third byte (53) is your diastolic pressure: 83 mmHg. The fourth and fifth bytes together form your diastolic pressure. An unsigned byte gives your a range of 256, but the unit can read a systolic pressure of up to 280 mmHg, making it necessary to use two bytes for that. Instead of using a big endian or little endian pattern, the scheme used was to store half of the systolic pressure in the fifth byte and use the fourth byte as flag that indicates if the number is odd instead of even. 80 means the flag is set, 0 means it isn’t. So in the case below, we have 44h which translates to 68 decimal. Multiply that by two and we get 136. Since the flag is set, we add 1, making it 137 mmHg. A little high, I know! But I was running around when I took the measurement :o) I guess this convoluted way of using the two bytes was chosen because it’s an 8 bit MCU and it didn’t need the full range of the 16 bits. I deduced that protocol by comparing the values to the measurements seen in the display.
On to the next step, I needed a way to get that data into the ESP8266. My first idea was to “eavesdrop” the bus while the MCU was talking. While that is certainly possible, it turned out to be a little more complicated. Sniffing messages not addressed to you is not regular feature of the hardware serial interfaces implemented in MCUs. It might be possible with a certain combination of configuration registers, but honestly, I didn’t look into it. I just wanted to use Arduino’s wire library, if possible. Another brute-force way would be to bitbang the protocol, but that’s not very efficient or clean. So I went a different route: I decided I would watch the bus for activity, wait a while, and try to read the new values straight off the memory chip, in a master-slave configuration. The I²C bus supports multi-master (both the MCU and the ESP8266 acting as masters). The trouble now would be to know where in the memory the new value was stored. For that I needed more data.
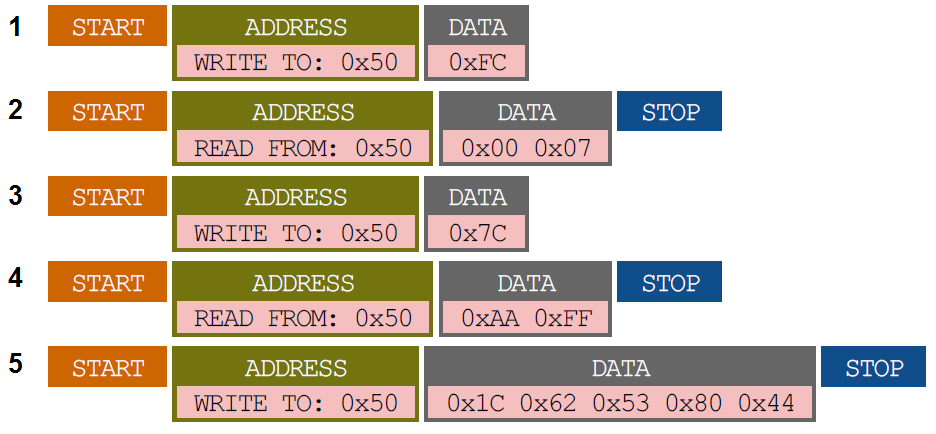
Paying closer attention to what the MCU was doing before writing the data, I noticed it would always read from FC before doing it (steps 1 & 2). That address turned out to contain the count of entries written to the memory. In the sample seen here there were 7 entries. So, to store new data, the MCU simply multiplied that by 4 bytes (the size of the entry), which gave it the offset for the new entry: 1C, which it uses in step 5. You might wonder what steps 3 & 4 are for, and honestly, I don’t know. It might be the software revision, as the MCU always writes the same data (AA FF) to the same address (7C), whenever it wants to store a new entry. For our purposes that is inconsequential. Having seen that, I decided to do a full memory dump to see what else it could tell me:
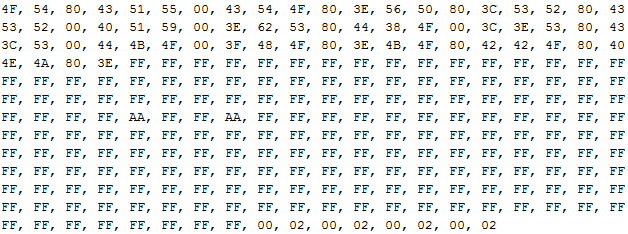
That is the full 256 bytes of the EEPROM. It’s not from the same moment as the steps above, so the data won’t match, but that’s not important. Bytes FC and FD are 00 and 02, respectively, which means the count was 2 at that moment. You can see that pattern is actually repeated 4 times in the last 8 bytes, which I imagine is for redundancy purposes, since the count is rewritten every time a new entry is stored. Flash memory can wear out wear in as low as 3000 cycles, so that’s a good idea.
Anyway, that solves our problem of knowing where to read the newest data. Read FC (or any of the redundancy addresses) and multiply it by 4.
Hooking things up
This is the very simple schematic of the circuit:
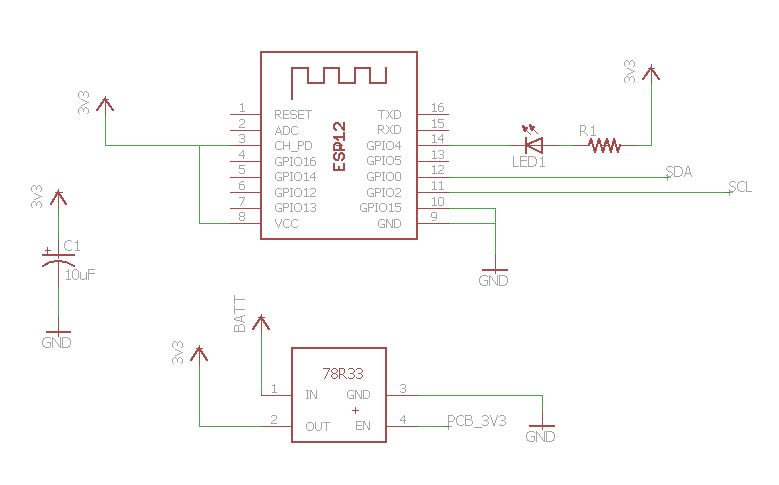
I used an LDO regulator (78R33) capable of 1A. The ESP8266 draws up to about 300mA when transmitting, so plan accordingly. The nice thing about this regulator is that it has an enable pin. That turned out to be very handy because by hooking it to a 3.3V line in the main PCB we get a remote control for the ESP8266: it automatically turns on and off with the blood pressure monitor. The led is for giving some feedback to the user: it lights up once a connection is established with the WiFi network, and blinks once data is pushed to the cloud (see code below). The capacitor is a simple power supply decouple.
Ok, Where Does That Data Go?
There are a million ways to store your data in the cloud, such as a flat file in a shared server, a MySQL database in a VPS, or any of the several IoT data services available. After a quick search I decided to use data.sparkfun.com, which is an anonymous, public and free service kindly provided by SparkFun. It’s based on Phant, an open source IoT logging tool created by SparkFun, so you can host it yourself if you wish. Pushing data is as simple as appending it to an URL. It might be worth mentioning I’m not using https and as such your data is subject to eavesdropping. Doing SSL/TLS on a microcontroller is hard work, since they’re usually so constrained on memory and processing power. If you want your data to be private, get creative… maybe do some kind of client side encryption/obfuscation or a local proxy server/router.
Anyways, using data.sparkfun.com is as simple as creating a stream and pushing data like this:
http://data.sparkfun.com/input/PUBLIC_KEY?private_key=PRIVATE_KEY&FIELD1=VALUE1&=FIELD2=VALUE2
That’s all there is to it, really. Check out the docs. You can then fetch your data using CSV, JSON or JSONP and do whatever you want with it. You can also download in SQL format later on if you wish. Later on we’re gonna plot this data using Google Charts.
Coding
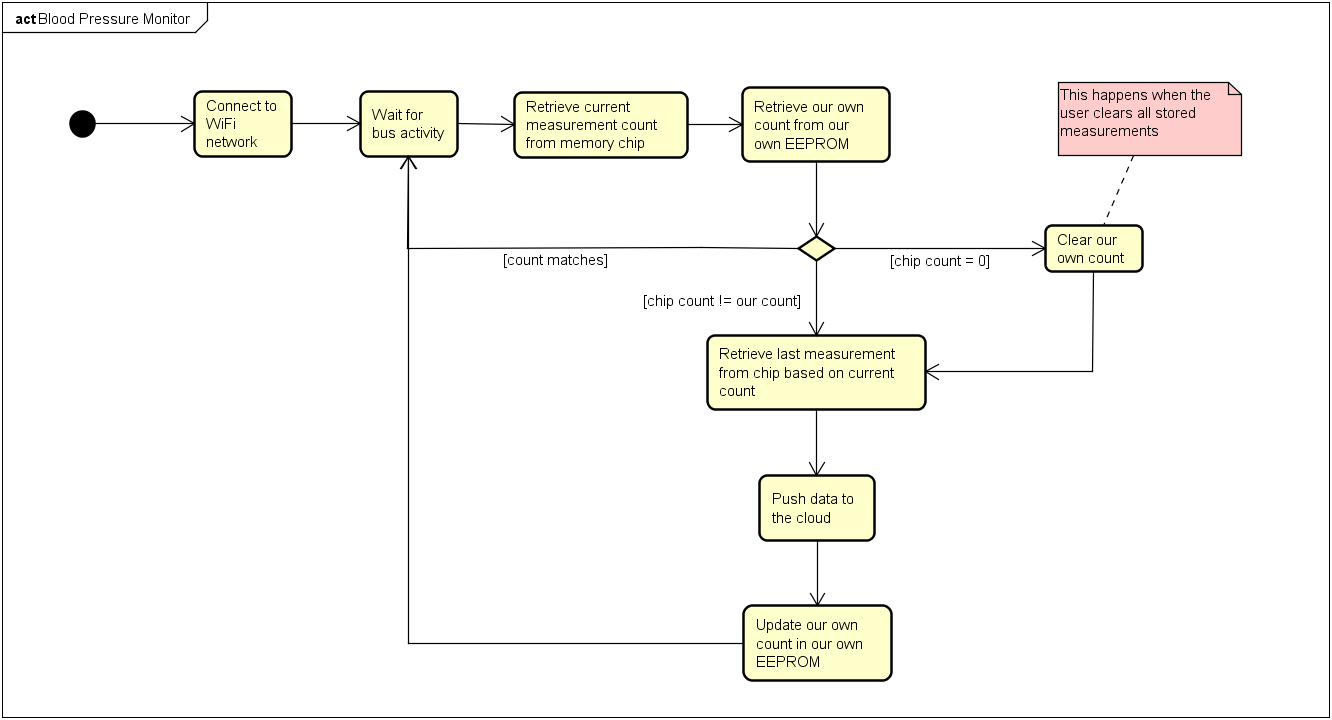
Alright. Now we get to coding. Have in mind this is not production-ready code, in case you’re thinking about buying a huge lot of monitors, modding them and selling on eBay (hey, if you do, cut me in 🙂 I’m kidding, this is OSS/OSH). For instance, you need to reprogram the ESP8266 if you need to change the WiFi SSID or password. There are clever ways to do that without reflashing it, but I’m avoiding scope creep . Well, check out below the activity diagram for what is in the code. The code is available on GitHub.
Show Me The Money!
Ok! Here’s video proof of the thing after it’s all done. The led lights up once it connects to the network, and blinks after pushing the data to the cloud.
The data
This is what the data could look like if you plot it using Google Charts, for example.
Wrapping Things Up
Well, this is what I had to share with you! I hope you enjoyed. It feels like writing this post actually took me longer than building and coding everything 🙂 Remember the disclaimer, be responsible and don’t use this as a medical device. Your comments are welcome!
Regards,
Eduardo
Pingback: Push Blood Pressure Data To The Cloud Via ESP8266 | Hackaday
Pingback: Tech News / Push Blood Pressure Data To The Cloud Via ESP8266
Pingback: Hacking a Blood Pressure Monitor - Electronics-Lab
Pingback: Push Blood Pressure Data To The Cloud Via ESP8266 | Ad Pub
Pingback: Hacking a Blood Pressure Monitor | Electronics Infoline
Pingback: Building a Smartphone Controlled Wake-up Light – Edu Steinhorst